Opus is moving to a new format for our reports (data tables). We will slowly move tables from the old to new format. The new format is outlined below and in the related articles.
As of April 2026, the only table using the new format is the Academic Apprentice Personnel report, which is currently only available to AAPO.
Opus data tables display records and data. Each row in a table represents one record, while the columns of that row contain the data associated with it. To help users work efficiently with their data, Opus data tables are highly flexible.
Because Opus records contain many types of data, its tables often have many columns, and are sometimes wider than the browser window in which they are viewed. Scroll the data table's contents to the left to view additional columns. Users can also edit which columns are visible, described further below.
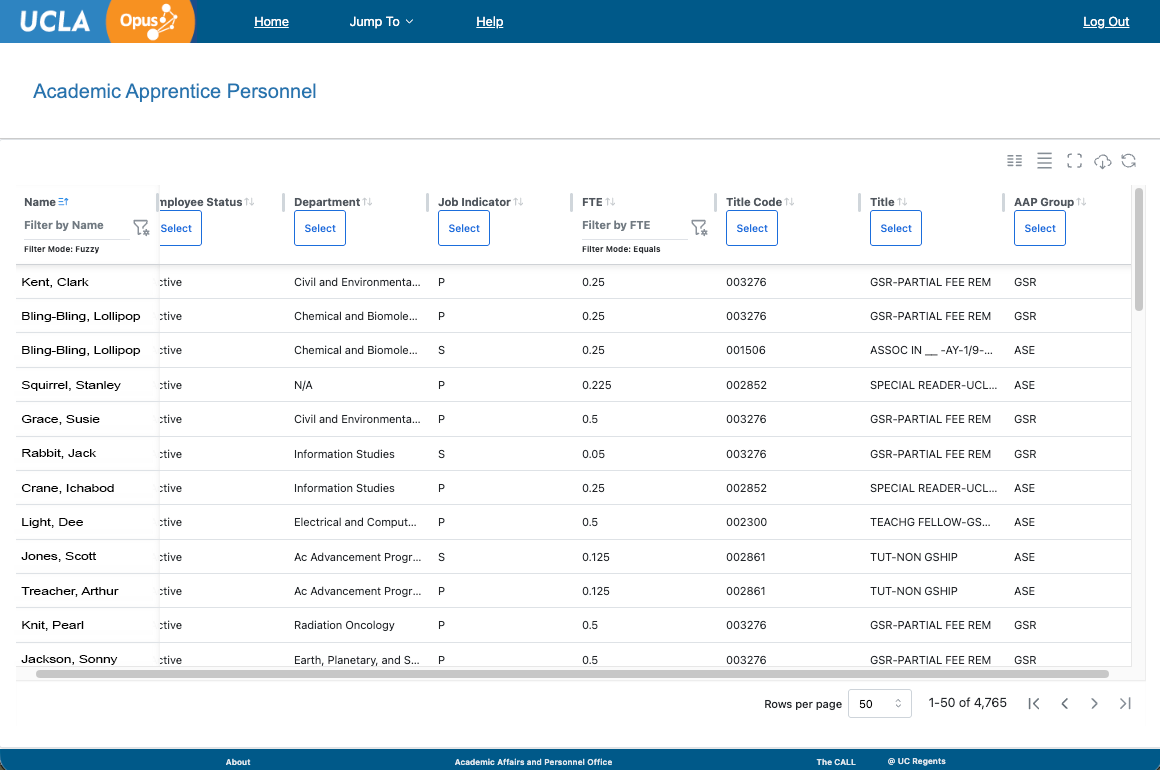
The Academic Apprentice Personnel page with its data table, demonstrating the left column as pinned.
Tip: If you need to see more rows in a data table, try using the zoom controls in your browser.
Table Features
 The buttons to the upper right of the data table allow the user to manipulate the columns displayed in a data table.
From left to right:
Show/Hide Columns
- Opens a modal with toggles for all available columns.
- Toggle on a column to make it visible. Toggle off a column to hide it. NOTE: you must always have at least one column visible.
- Drag and drop columns to change the order.
- Pin columns to freeze them on either the left or the right of the data table.
Toggle Density (Change row height)
- Changes the row height. Users can toggle the row height between: compact, comfortable, or expansive.
Toggle Full Screen (Maximize Table)
- Maximizes the table to a full screen view. Click the button again to restore the default page view.
- Maximizing the table hides all content (including buttons) above the table.
Download Report
- Downloads an excel file. The file will contain exactly what is visible in the data table including any applied filters and sorting.
Reset Table
- Resets the data table back to its default state. Removes applied sorts and filters, resets column order, resets which columns are visible on the table.
- Tip: If you have applied many Data Table Filters and/or Sorting Options, and need to quickly back away from these changes, consider using the "Reset Table" button.

Rows per Page
- Choose how many records will be visible on each page of the table, ranging from 5-100. Use the arrows to move to the next, previous, first, or last page.
Record Count
- The count of records is shown near the lower-right corner of the data table. The record count updates as filters are applied — for more information see the article on filtering linked near the bottom of this page. !
See Also
Data Tables: Sorting Data Within A Table
Data Tables: Filtering Data Within A Table